Population- 127.6 million
Arithmetic Density- 880
Physiological Density-7219
Net Migration Rate-0
Birth Rate- 8.23
Death rate-9.27
Rate of Natural Increase- -.22
Population growth rate- -0.1
Infant mortality rate-2.17
Total fertility rate- 1.39
Arithmetic Density- 880
Physiological Density-7219
Net Migration Rate-0
Birth Rate- 8.23
Death rate-9.27
Rate of Natural Increase- -.22
Population growth rate- -0.1
Infant mortality rate-2.17
Total fertility rate- 1.39
Population ages < 15 -13.4%
Population ages 65+ - 24.8%
Dependency rate- 38.2%
Life expectancy at birth-84.19
Female Life expectancy-87.71
Male Life expectancy-80.85
Primary School Completion Rate(Females)-99.9%
Primary School completion Rate(Males)-100.0%
Secondary School enrollment net(Females)-99.9%
Secondary School enrollment net(Males)-100.0%
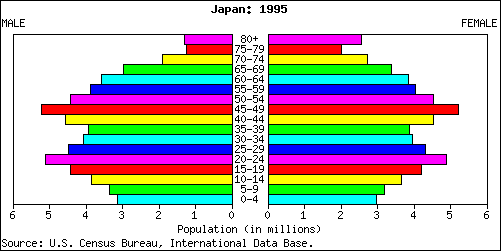
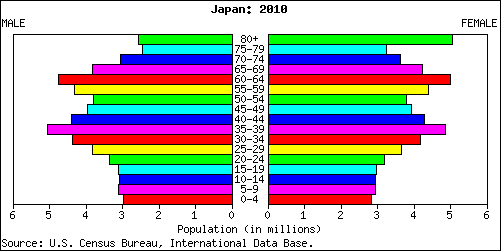

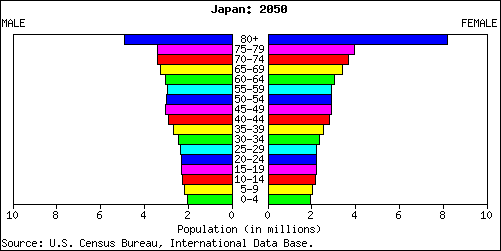

Japan is in stage 5 of the Demographic transition Model. In this graph, you see the only population decrease is in Stage 5. Japan's population is decreasing by .023% per year. This is due to low birth rates, health factors and emigration(out migration.) If this continues Japan's population will continue to decrease until there are eventually very few people.
